

A good rank tracking dashboard shows where each keyword ranks, in which country and on which device. It also shows the page-level reason a ranking moved, such as a 404, a redirect or a stray noindex. When you buy one, the pricing model matters most. Subscriptions charge for seats and keyword caps, while self-hosted tools charge per check. That means daily tracking at volume favors a subscription, and weekly or small-set tracking favors owning the tool.
TL;DR:
- A useful tracking dashboard pairs position history with the ranking URL and page health, so you can see why a keyword dropped and not only that it did.
- Tracked rank and Search Console average position measure different things, and they only become comparable once you filter Search Console to the same country.
- Every keyword-country pair is a separate check, so tracking 100 keywords in 5 countries daily costs the same as tracking 500 keywords in one country daily.
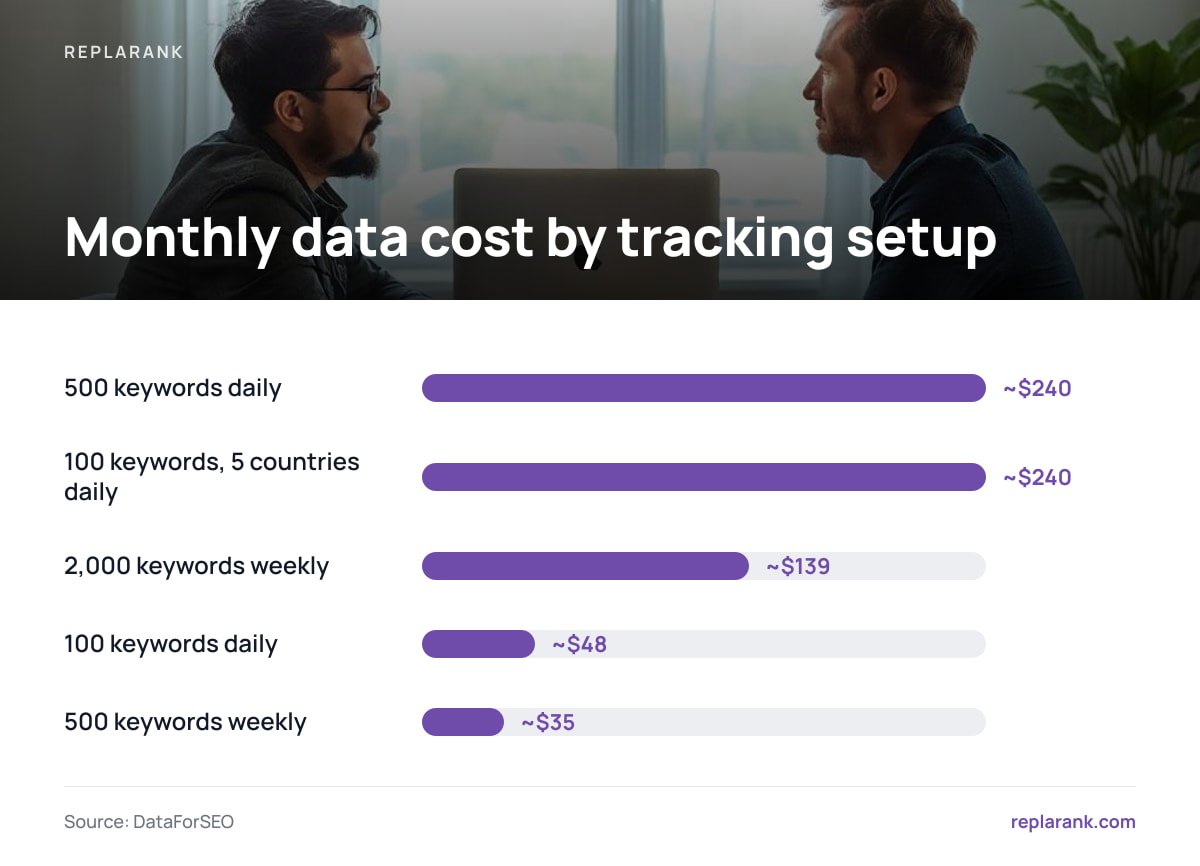
- At roughly 1.6 cents per fresh check, 500 keywords tracked daily costs about $240 a month, far more than a $49 entry-level subscription. The same set tracked weekly costs about $35.
- Self-hosting wins on weekly checks, small keyword sets, unlimited sites and users, and owning your data. Subscriptions win on large daily tracking.
Table of Contents
- What a Tracking Dashboard Has to Show, and What Is Just Decoration
- Tracked Rank vs. Search Console Position: Why Your Two Numbers Disagree
- Multi-Country Rank Tracking: Where Costs and Errors Multiply
- Client Dashboards: Sharing Rankings Without Leaking Them
- What a Tracking Dashboard Really Costs: Per-Check Math vs. Monthly Plans
- Which Dashboard Setup to Pick, by How You Actually Track
- Asking Your Dashboard Questions Instead of Clicking Through It
- Get Position History and Page Health in One Dashboard You Own
- Frequently Asked Questions
- Sources
What a Tracking Dashboard Has to Show, and What Is Just Decoration
Most rank tracking dashboards look alike in screenshots: a line chart, some green and red arrows, a visibility score. The difference shows up the morning a client's main keyword drops from position 4 to 19. One dashboard tells you it dropped. A better one tells you the ranking page started returning a 301 to a thin category page two days earlier.
These are the parts that earn their place on screen:
- Position history per keyword, per country, per device. A single "rank" number is meaningless without the location and device it was checked from. Mobile and desktop results diverge often enough that blending them hides real movement.
- The ranking URL, not just the rank. If the position holds steady but the URL behind it switches from your product page to a blog post, you have a cannibalization problem that a position chart will never show.
- Page health beside the position. A 404, a redirect chain, a noindex tag or a canonical pointing elsewhere explains a large share of sudden drops. Checking these in a separate tool means you diagnose a day late. Our breakdown of tools that detect 404 errors and redirects covers what that check should include.
- Real click data. Rank is a proxy. Clicks from Search Console are the outcome. A dashboard that shows both lets you spot a stable ranking with collapsing traffic, which usually points to a SERP layout change rather than an SEO failure.
Treat everything else as decoration until it proves otherwise. Blended visibility indexes are the main offender. They fold hundreds of keywords into one number weighted by estimated volume, so a 3% dip can mean one money keyword fell off page one or forty irrelevant ones shuffled. We would rather read twenty keyword rows than one index.
Tracked Rank vs. Search Console Position: Why Your Two Numbers Disagree
Your rank tracker and Search Console will rarely show the same position for the same query, and neither is wrong. A tracker runs a single, unpersonalized check from a fixed location and device at one moment. Search Console reports an average of your site's topmost position across every real impression, from every user, location and device that saw it.
Google's Search Console documentation on the Performance report describes position as an average. That average is pulled around by personalization, local results and the mix of devices your audience uses. A tracked rank of 6 and an average position of 8.4 can both be accurate.
16 months. That is how long Search Console keeps Performance data. Anything older is gone from Google's interface unless you exported it.
That retention limit matters more than most dashboard buyers realize. Year-over-year comparisons for a seasonal client need more than 12 months of history, and a two-year view is out of reach entirely if you only rely on Google. A dashboard that syncs Search Console daily and stores the data by query and date keeps that history after Google drops it.
Pro Tip: Before you compare a tracked rank to Search Console, filter Search Console to the same country you tracked. The default Performance view combines all countries, so your US tracked rank of 5 is being compared against an average that includes your position in India, Canada and everywhere else. Once you filter by country, a persistent gap of more than three or four positions is worth investigating. It often means a different URL from your site is ranking for part of the audience.
Multi-Country Rank Tracking: Where Costs and Errors Multiply
Tracking across countries is where dashboard costs grow fastest. Every keyword-country pair is its own check. One hundred keywords tracked in five countries is 500 checks per run, the same cost as 500 keywords in a single market. Budgets built on keyword count alone break here.
The common failure is the wrong page ranking in the wrong market. Your UK page shows up in Australian results, or the US page outranks the localized German one in Germany. Google's guidance on localized versions of pages explains how hreflang annotations tell Google which language and regional variant belongs where. Broken or missing hreflang is a frequent cause of this mismatch.
A dashboard only catches it if it records the ranking URL for each country. A position of 3 in Australia looks like a win until you see it belongs to the .co.uk page, with prices in pounds.
Two rules keep multi-country tracking honest:
- Track the markets you sell in, not the markets you might. Each speculative country multiplies your check count for data you will not act on.
- Separate mobile from desktop per country. Mobile share varies widely by market, so the device that matters in one country may not be the one that matters in another.
We cover the per-country setup and its costs in more detail in rankings by country: how to track them right.
Client Dashboards: Sharing Rankings Without Leaking Them

Agencies need a way to put rankings in front of clients without exporting spreadsheets every week. The simplest method is a share link: a read-only URL that opens the client's dashboard without a login. It is convenient, and it carries one risk people forget. If the link gets posted anywhere crawlable, the client's full keyword strategy can end up in search results.
The fix is a noindex directive on every shared page. Google Search Central's documentation on blocking indexing confirms that a noindex rule keeps a page out of Google's results even when other pages link to it. Check this on any dashboard you evaluate. Open a share link, view the source or response headers, and look for noindex. If it is missing, treat every share link as public.
Client isolation matters just as much as sharing. Each client, or brand, should have its own keyword list, history and budget. A hard per-brand spend limit stops one client's runaway keyword import from consuming another client's monthly allowance. That matters most when you pay per check, because an accidental 10,000-keyword upload is a real invoice, not a quota warning.
Be honest about what your clients expect. If they want a branded PDF in their inbox every Monday, or their own login with their logo on it, a share link will not satisfy them. Buy a tool built around reporting.
What a Tracking Dashboard Really Costs: Per-Check Math vs. Monthly Plans

Subscription dashboards bundle data, hosting and software into a monthly fee with keyword and site caps. Self-hosted dashboards separate the costs: you pay once for the software, run it on your own server, and pay the search-data provider for each check. With DataForSEO's pay-as-you-go pricing, a fresh rank check works out to roughly 1.6 cents.
Here is what that rate means across common setups, using about 4.33 weekly runs per month:
| Tracking setup | Checks per month | Data cost per month |
|---|---|---|
| 100 keywords, daily, 1 country | ~3,000 | ~$48 |
| 500 keywords, daily, 1 country | ~15,000 | ~$240 |
| 100 keywords, daily, 5 countries | ~15,000 | ~$240 |
| 500 keywords, weekly, 1 country | ~2,165 | ~$35 |
| 2,000 keywords, weekly, 1 country | ~8,665 | ~$139 |
500 keywords checked daily costs about $240 a month in search data alone. Entry-level subscriptions commonly start around $49.
Daily tracking at volume is cheaper on a subscription, and it is not close. If you need 500 keywords checked every day, rent the tool.
The break-even sits at about 3,000 checks a month in data costs alone, roughly 100 keywords daily or 700 weekly. If you spread a one-time license over two years, the line moves lower: about 65 keywords daily or 470 weekly. Server costs push it lower still.
Self-hosting wins in other places:
- Weekly cadence. Most keywords do not need daily checks. Weekly is enough to see a trend, and it costs about a seventh as much.
- Small keyword sets. Freelancers tracking 50 keywords across a handful of sites pay cents, not a monthly floor.
- Many sites and users. Subscription tiers cap both. A self-hosted install does not.
- Ownership. The history lives in your database and does not disappear when a plan lapses.
For a fuller breakdown of what rank checks actually measure and cost, see our guide to keyword rank tracking.
Which Dashboard Setup to Pick, by How You Actually Track
| Your situation | What we would pick | Why |
|---|---|---|
| 300+ keywords that genuinely need daily checks | Subscription | Per-check costs pass $49 quickly at daily volume |
| Agency, 15 clients, mostly weekly tracking | Self-hosted | No per-site caps, weekly data costs stay low |
| Freelancer, under 100 keywords total | Self-hosted | Data costs are a few dollars a month |
| Clients require branded emailed reports | Subscription built for reporting | Share links will not meet that expectation |
| Developer who wants raw data and API access | Self-hosted | You own the database and can query it directly |
The mixed approach often beats both pure options. Track the 20 to 50 keywords that drive revenue daily, and everything else weekly. A 50-keyword daily core plus 1,000 weekly keywords comes to roughly 6,000 checks, or about $96 a month. That still beats most mid-tier plans, and the daily view covers the keywords where speed actually matters.
Asking Your Dashboard Questions Instead of Clicking Through It
The newest change to rank tracking dashboards has nothing to do with charts. You can now query your ranking data from an AI assistant. The Model Context Protocol is an open standard that lets assistants such as Claude Desktop, Claude Code and Cursor call tools on your machine.
Connected to a rank tracker, this lets you ask for "every keyword that lost more than five positions this week where the ranking page now redirects" instead of building that filter by hand. The answer comes back from your own data, not from the model's guesses.
Check how any such integration runs before you depend on it. A local server that communicates over stdio keeps your data on your machine. It also means it works only with desktop and editor clients, not with browser-based chat products.
Get Position History and Page Health in One Dashboard You Own

ReplaRank is a self-hosted rank tracker you buy once for $399 and run on your own server, with a one-command install and zero npm dependencies. It covers the problems described above:
- Mobile rank tracking across 35 countries.
- Page checks for 404s, redirects, noindex and canonical issues on desktop, mobile or both.
- Daily Search Console sync that keeps history past Google's 16 months, by query and date.
- Isolated brands, each with its own spend limit.
- Login-free share links that carry noindex, plus CSV export.
- A local MCP server with 50 tools, five of them for Search Console, that works with Claude Desktop, Claude Code and Cursor.
The caveat is the one in the table. You pay DataForSEO directly at roughly 1.6 cents per check, so tracking hundreds of keywords daily costs more than a subscription. ReplaRank also has no scheduled or emailed reports and no white-labeling. If your clients need either, look elsewhere. If you track weekly or track small sets across many sites, run the math above with your own keyword counts first.
Frequently Asked Questions
What should a rank tracking dashboard show besides keyword positions?
It should show the ranking URL for each keyword, the country and device it was checked from, and page health signals such as 404s, redirects, noindex and canonical issues. Adding Search Console click data shows whether a ranking change actually affected traffic. Without these, you can see that a keyword dropped but not why.
Why does my rank tracker disagree with Google Search Console?
A rank tracker runs one unpersonalized check from a fixed location and device. Search Console averages your site's topmost position across every real impression from every user. Filter Search Console to the same country you track before comparing, because its default view combines all countries.
Is a self-hosted rank tracker cheaper than a subscription?
It depends on volume and frequency. At roughly 1.6 cents per check, 500 keywords tracked daily costs about $240 a month, far more than a typical $49 entry-level subscription. Tracked weekly, the same 500 keywords cost about $35 a month, which is where self-hosting comes out ahead.
How does multi-country tracking affect dashboard costs?
Each keyword-country combination is a separate check. Tracking 100 keywords in five countries daily costs the same as tracking 500 keywords in one country daily. Only track the markets you actually sell in.
Are dashboard share links safe to send to clients?
They are safe if the shared pages carry a noindex directive, which keeps them out of Google's results even if someone links to them. Without noindex, a share link posted somewhere public could expose a client's keyword strategy in search results. Check the page source or response headers of any share link before you rely on it.
Sources
- Performance report (Search results) – Search Console Help | Google
- Block Search Indexing with noindex | Google Search Central
- Tell Google about localized versions of your page | Google Search Central
- Pricing | DataForSEO
- Model Context Protocol | Model Context Protocol